In addition to many built-in data visualizations, RaceRender allows you to combine multiple display objects, including external images, to create your own complex gauges or other visualizations. Some of these methods require RaceRender Advanced or Ultimate Edition.
The most common use for this is to recreate the look of a real gauge cluster or display system. It usually involves obtaining an image of the desired display with a blank screen and then using that in RaceRender as your background, with various data visualization objects overlaid on top of it.
Gauge Images
To make a realistic gauge, you can start with a real image of the desired gauge without a needle, and then have RaceRender create and animate a gauge needle on top of it. There are two options for doing this:
- Option 1: Import a gauge image directly into a RaceRender gauge:
- Edit the gauge image so that it contains only this one specific gauge, and is centered so that the needle's center point is in the exact center of the image.
- Create a Gauge display object in RaceRender, turn off its Face and Trim options, then set its Background Image to use your edited gauge image.
- Use the Gauge Designer to adjust the Gauge Sweep, Rotate, and Data Range to match the background image.
- If your gauge changes the distance between intervals / steps at some point, you can go to the Mid-Point Stepping Change section and use the Split at Data Point option to set the data point at which it differs, and the Relative Angle option to control where that point is placed on the gauge.
- Once the alignment is acceptable, turn off the Draw Labels, Data Number, and Interval / Fraction Marking options, so all that remains is RaceRender's generated gauge needle over the background image. This gauge can now be exported as a style or in a template, for easy use in other projects or by other users.
- Option 2: Add the gauge image as its own object, then overlay the needle(s) separately:
- Add the gauge image by itself to your RaceRender project
- Add a Gauge display object and turn off its Face and Trim options.
- Align this Gauge's position and size with the image, and use the Gauge Designer to adjust the Gauge Sweep, Rotate, and Data Range to match the image.
- If your gauge changes the distance between intervals / steps at some point, you can go to the Mid-Point Stepping Change section and use the Split at Data Point option to set the data point at which it differs, and the Relative Angle option to control where that point is placed on the gauge.
- Once the alignment is acceptable, turn off the Draw Labels, Data Number, and Interval / Fraction Marking options, so all that remains is RaceRender's generated gauge needle over the image.
- You may wish to group these objects together so that they act more like a single object. You can also export them in a template for use in other projects or by other users.
Enhanced Object Scripting
For advanced users with programming experience, Enhanced display objects can be a powerful tool for creating unconventional, unique, or one-off displays. Although RaceRender offers many customizations and possibilities with its easy-to-use traditional gauges and graphs, and the ability to group them together to create more complex displays, sometimes there's a desire to go even further. Enhanced display objects offer a way to script how the display is generated, which can then be exported and shared with other users, so that even non-technical users can enjoy the results. For more information, please see the Enhanced Display Object documentation page.
Filled Areas
You are also able to make areas of an image transparent (or use RaceRender's Chroma Key functionality to do so), and then place a Bar Graph object behind it, so that it appears to fill only that area and shape with the bar graph's color. This is most commonly useful for slightly curved or other-shaped tachometer and speedometer graphs.
Example Using Chroma Key Method
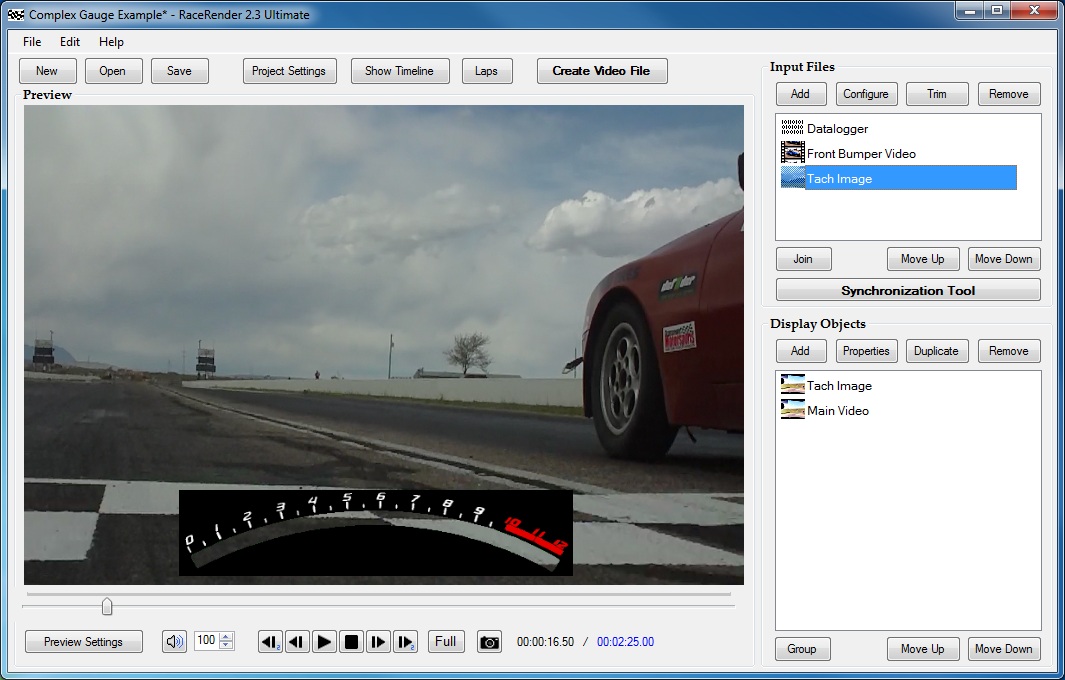
- This example will demonstrate creating a realistic curved tachometer.
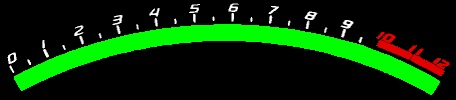
- Start with an image of a real guage, edited to be blank and fill the curved
tachometer area with full green (for later use with Chroma Key)...
- Add it to your RaceRender Project...
- Open its Input File Configuration screen and check Chroma Key Enabled...
The Color to Make Transparent must match the color that the image was filled with. Full green (0, 255, 0) is recommended.
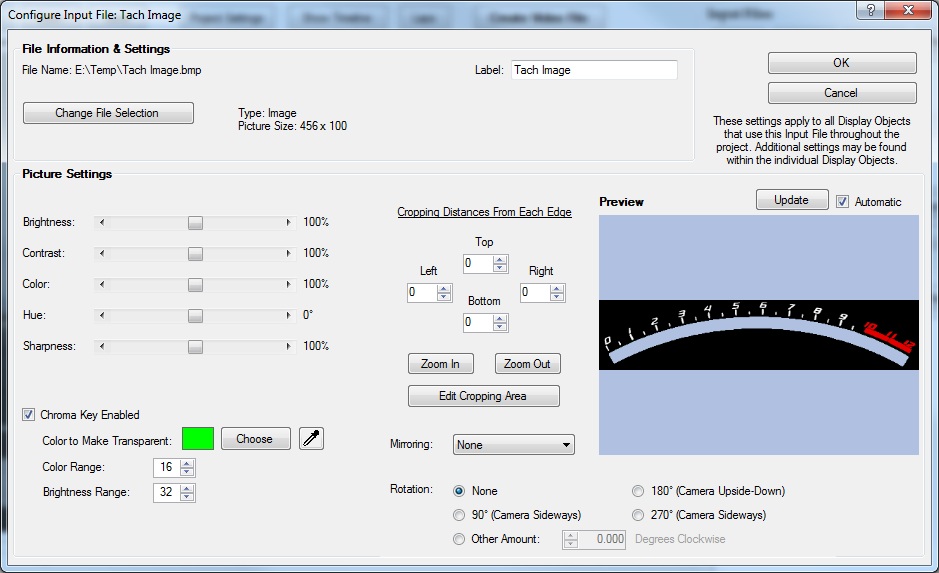
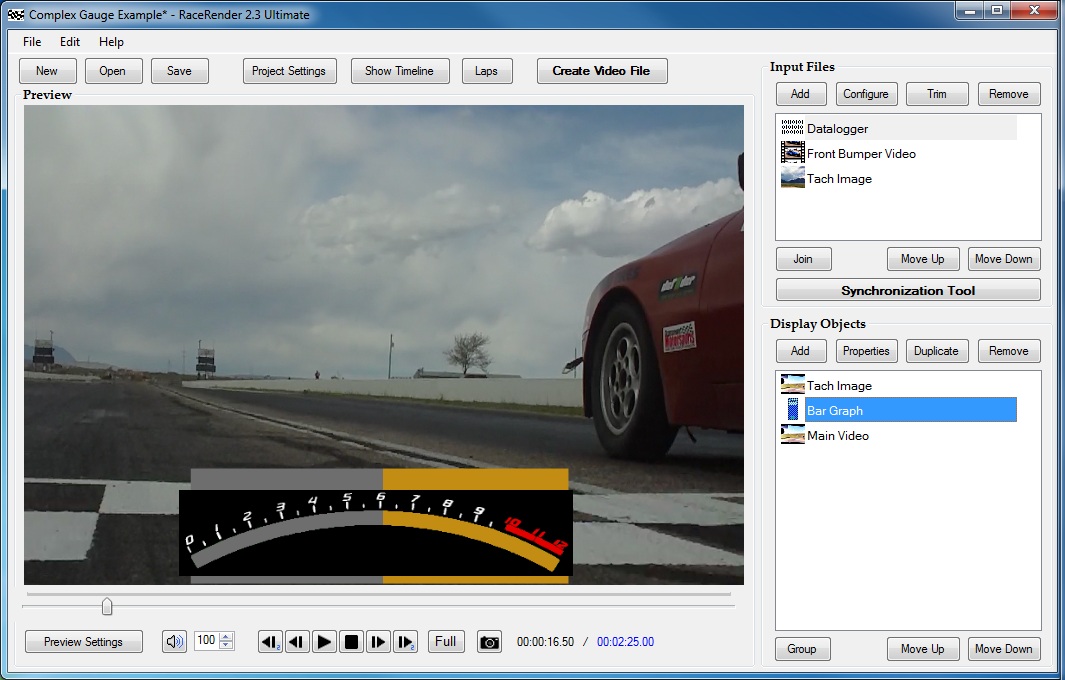
- It should now appear with transparency in the filled area...
- Now create a horizontal bar graph for the engine RPM (using the Datalogger as the input)...
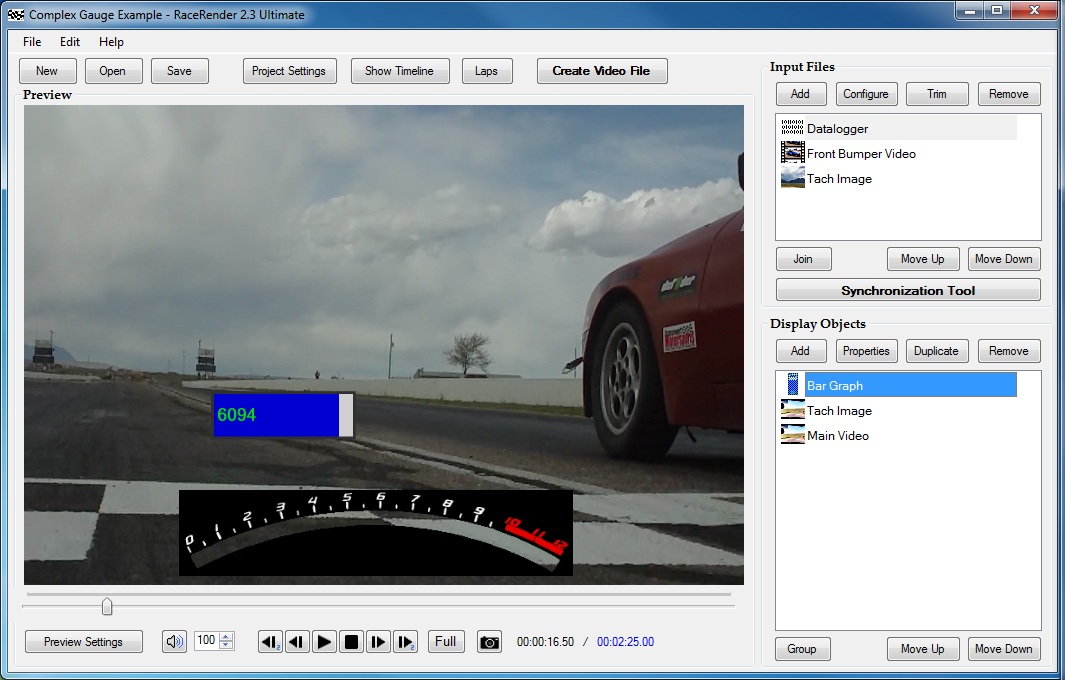
- Set its Min and Max ranges to match the tachometer image. In this case Min = 0, Max = 12000.
Also turn off the "Data Number" display, "Trim", and set the desired colors.
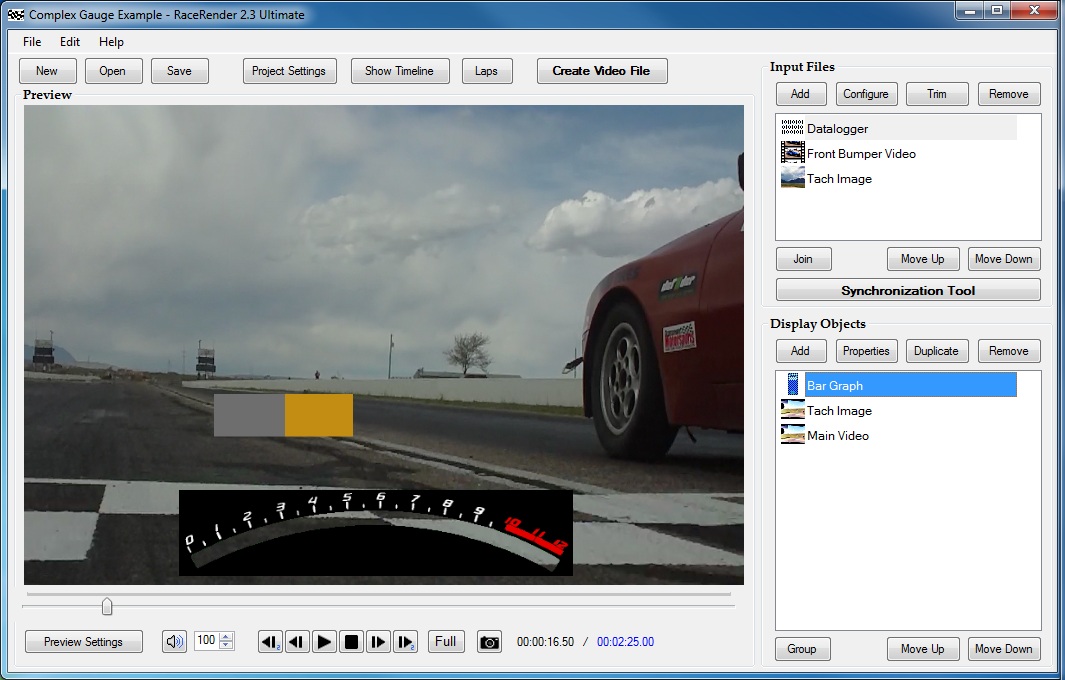
- Expand the bar graph to match the size of the gauge background image... In this case, the image
is set to a width of 54.687% and a height of 18.0%, so that's a good start to set the bar graph to.
Some additional fine-tuning is usually helpful.
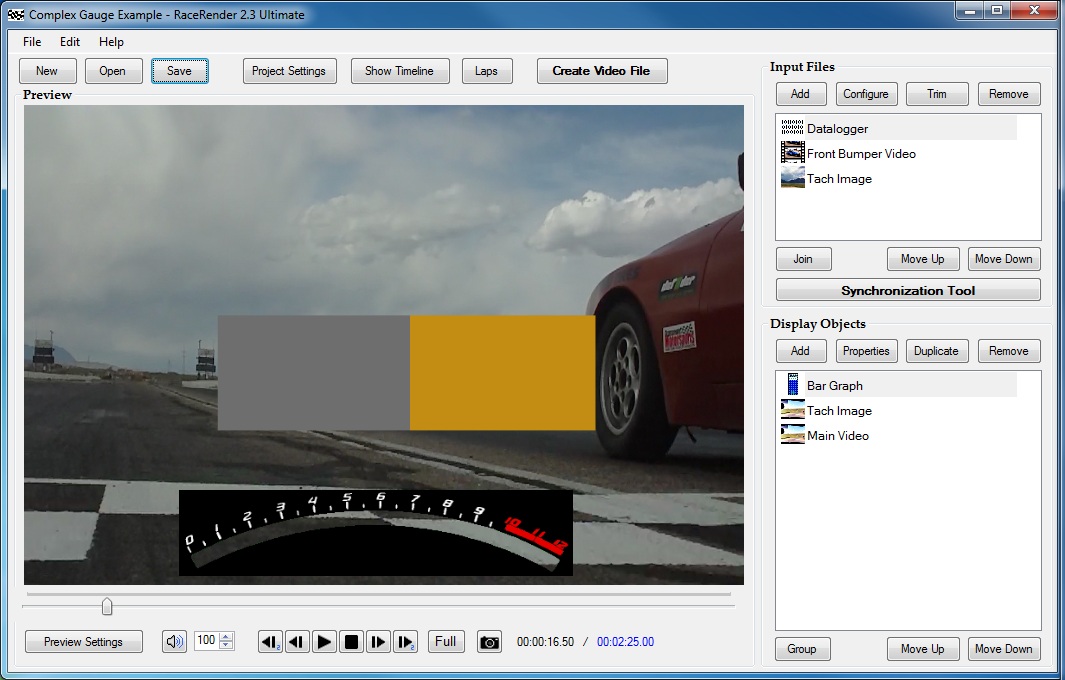
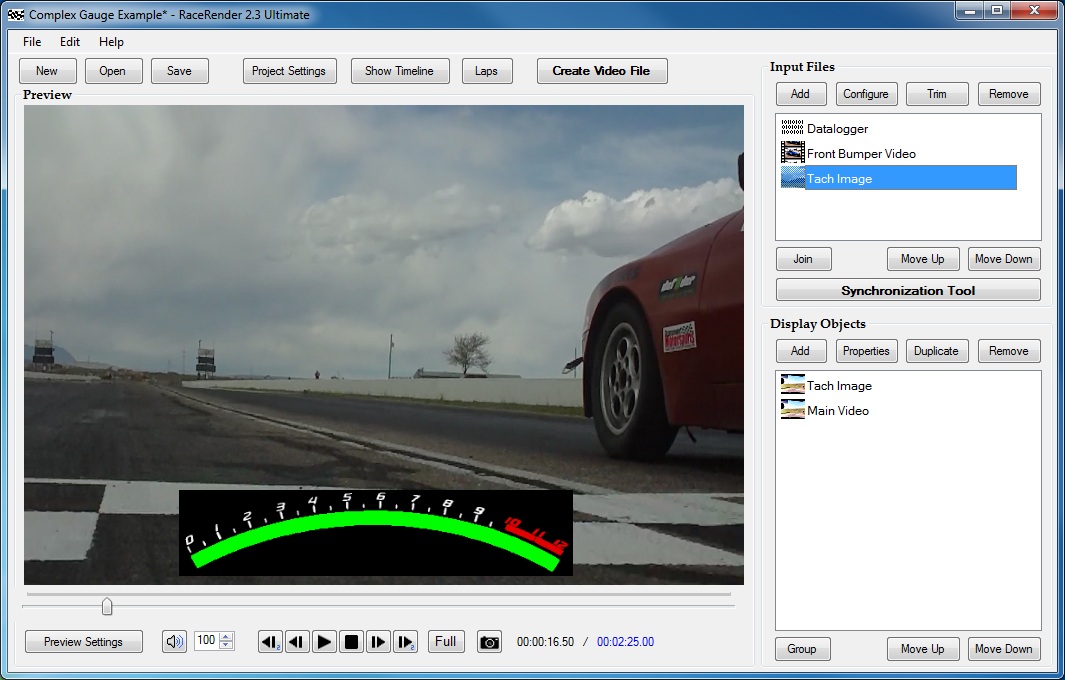
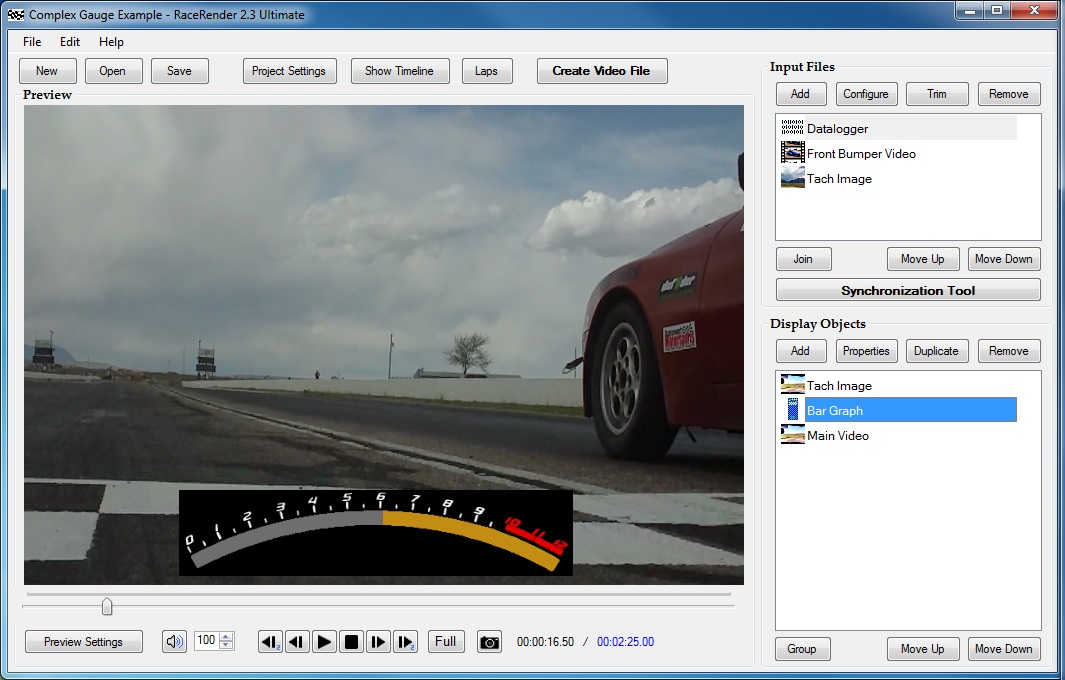
- Now we will place it behind the gauge background image, so that it fills the transparent
tachometer area. First, select it in the "Display Objects" list and click the Move Down
button until it is under the image's display object. This changes the drawing order so that
the bar graph is behind the background. Second, move the bar graph down to the same area
as the background image...
- Set the bar graph's Thickness setting so that it better matches the size of
the image, eliminating the excess...
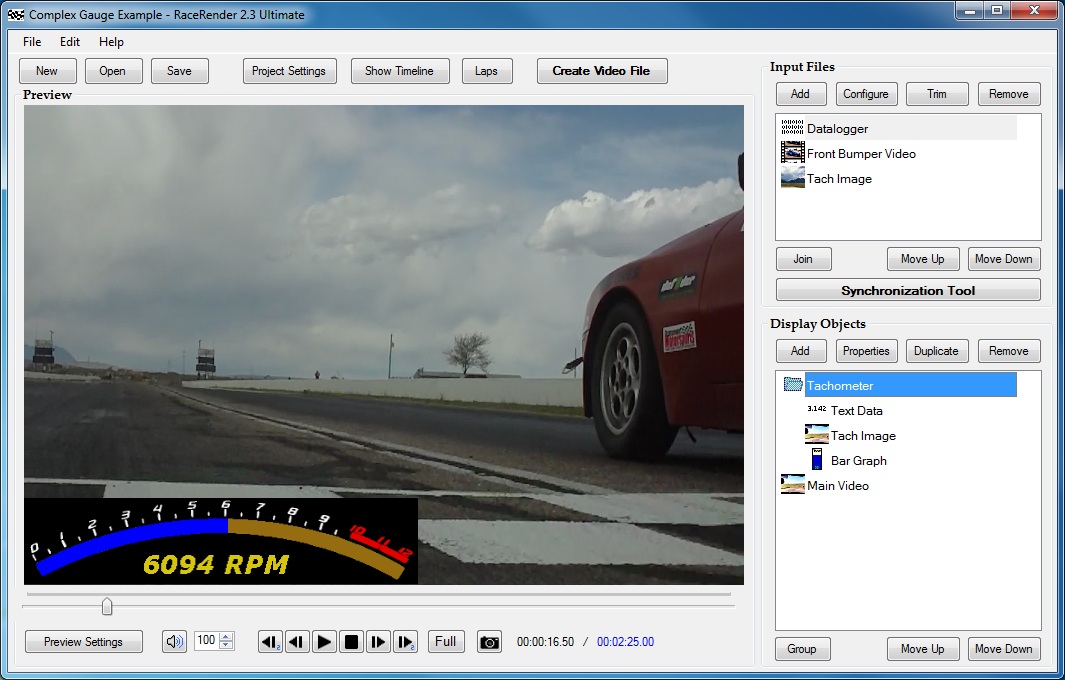
- You now have your data displayed as a curved tachometer using a real image. You
can further improve this by fine-tuning the alignment & size, adding a Text Data display
object to show the RPM number, other visualizations, adjust the color more, etc. Also,
you can group all of these related display objects together, so that they can be moved
as one.
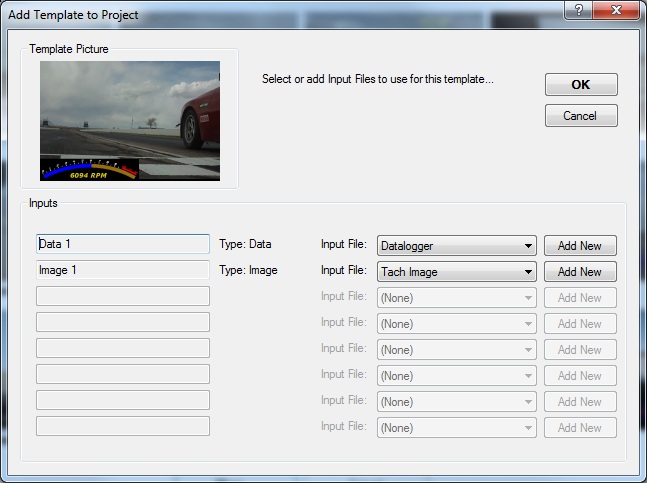
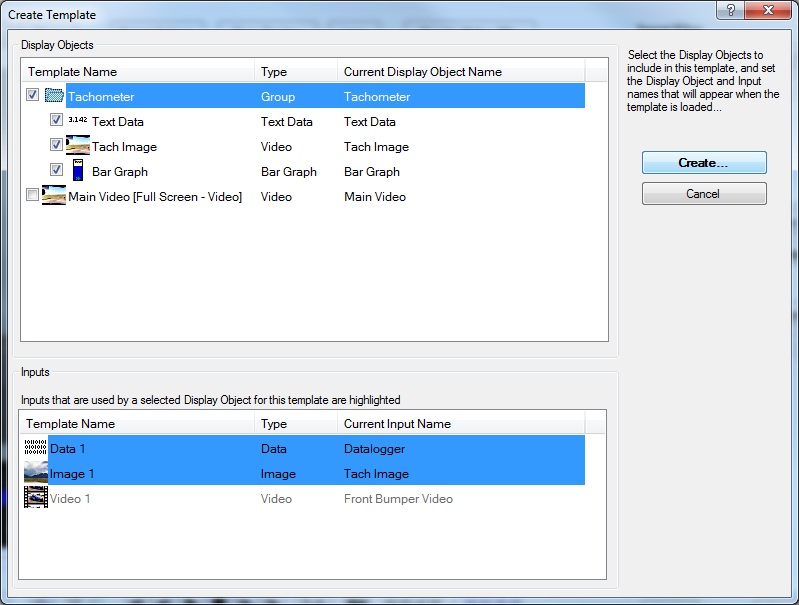
- Your work can optionally be exported as a template (File -> Export Layout as Template...)
for use in other projects, or by other RaceRender users. Export the display objects related
to this gauge, but not the actual video or other objects.
(In this case, your gauge image file will need to accompany your template.)
- Once exported as a template, it can be quick and easy to add to other projects...
(File -> Add Template to Project...)